Overview of Project Goals
In this project, I explored the practical applications of parallel coordinate visualizations for supporting exploratory data analysis in systematic biology. Systematists attempting to uncover the evolutionary relationships between a group of organisms (phylogeny) will generate large data sets, where each character must be carefully assessed for suitability before it is included in the final phylogenetic analysis. Parallel coordinate plots are designed to represent multi-dimensional data, and this project showed they can be useful for identifying features of morphometric data sets that are important to phylogenetic analysis. Completing this project also suggested what types of interactions should be supported by a parallel coordinates visualization tool intended for systematics.
Contents
- Background on Biological Systematics
- Introduction to this Project
- Related Work
- Methods - Tools, Data, and Collaborators
- Results
- Morphometric Data
- Multi-state Data
- Molecular Data
- Conclusions
- Future Work
- Comparing Parallel Coordinates Interaction Tools
- Tool Requirements for Systematics
- References
Background on Biological Systematics
To make an evolutionary tree, biologists take organisms, identify attributes that have different values due to evolutionary events (characters and character states), and make a huge matrix encoding which state each organism has, then using algorithms to convert the matrix into a tree. My interest is in determining if parallel coordinates visualization can assist in the early part of the process, for identifying attributes/characters and values/states.
click to enlarge or reduce screenshot
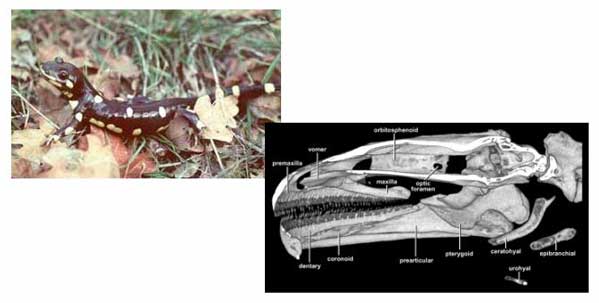
Start with specimens of organisms, representing the moment in time when they were collected.[7]
When conducting systematics studies on a group of organisms, a biologist will select a number of characters that seem to be informative for identifying the evolutionary relationships between various taxa. One character will have multiple states - for example, present/absent, 1 bump/2 bumps/3 bumps, or A/C/T/G.
click to enlarge or reduce screenshot
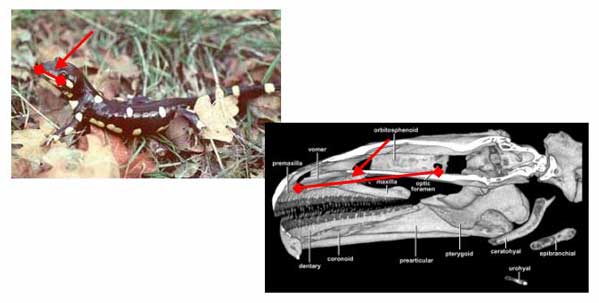
Identify potential characters. Here, the distance between the nostril and the eye of the salamander is proposed as a character, and measured.[7]
After this initial selection and especially for morphological measurements, the characters must be checked thoroughly to ensure that they are heritable and independent. Heritable characters are those for which the offspring of the organism in the study will have the same state for that character. Independence means that the character is the only one representing that particular evolutionary change. Put another way, one evolutionary change might be measured or identified by several characters, but only one of these characters should be used to attempt to determine the phylogenetic tree of the organisms.
Correlations that result from sharing the same ancestor, such as hair and mammary glands for mammals, are good correlations; each character provides independent information which happens to support the same phylogeny. However, correlations that result from two characters measuring the same processes within the organism (for example, head length and head width might both be measures of head size) aren't contributing independent information to the phylogenetic analysis. Including all of the characters would be over-representing that particular evolutionary change within the analysis.
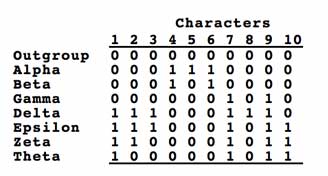
The character matrix encodes which specimens (or indistinguishable groups of specimens, a.k.a. "OTUs") have which characters.[7]
The matrix of acceptable characters represents a series of hypotheses of how the various taxa could be grouped. These groupings may be compatible with each other, but more likely many are in conflict. Tree-making algorithms step through the matrix and attempt to resolve these groupings with a tree that minimizes the number of times a character must be assumed to have changed states during the process of evolution.
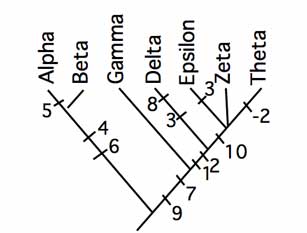
Biologists use software to apply an algorithm to reconcile groupings and propose a tree. While most groupings support this tree, it requires assuming that character 2 changed back to the ancestral state in the taxon "Theta". Tree-making algorithms attempt to minimize these changes.[7]
Introduction to this Project
Types of Character Data
Characters originate from a number of different types of studies, including molecular (genes, proteins, chromosomes), morphological observations, chemical products, and behavior. Data from certain of these study types may be more interesting in this analysis; presumably characters with more than presence/absence values, for example. Characters identified during a morphometric analysis may be of particular interest, as this process generates highly multi-dimensional data usually reduced to fewer dimensions using Principle Component Analysis, a multi-variate statistical technique. This project attempts to characterize for which data types explorations using parallel coordinate display might be most helpful.
Phylogenetic Data Features
The explorations conducted for this project also aimed to identify if parallel coordinate plots provide distinctive visual patterns of phenomena in the data that would be informative for phylogenetic analyses, such as:
- (a) correlations between characters
- (b) suggesting characters for conducting gap analysis
- (c) parsimoniously informative characters
- (d) compatibility between characters and character cliques
(a) correlations between characters
Identification of correlated characters allows the biologist to evaluate if the criteria of independence is being met. Within morphometric data, a cluster of correlated measurements could suggest that they need to be somehow combined into a new number that will represent an independent axis of morphological change.
The closer the biologist gets to the final analysis, the more important character independence is. Well-established statistical tests can be used to test for correlation between two characters. However, final character matrices might have hundreds of characters - which of these should be examined by the statistical methods? Parallel coordinate plot visualizations might help the biologist identify which characters to test for correlation using statistical methods. The biology behind the correlation can then be investigated, and a decision made about whether the correlated characters are both contributing independent information to the analysis. Although it would be useful if the plots could distinguish this too, it is unlikely.
(b) gap analysis
Gap analysis involves looking for natural breaks in the ranges of measurements collected for one character in order to create codable character states. Statistical methods are applied to identify if the gap is statistically significant. Gap analysis supports the division of real-number data into the discrete character states necessary to complete a phylogenetic analysis.
(c) parsimoniously informative characters
To allow scientists to test previous evolutionary assumptions, each line in the matrix is not a species, but rather an operational taxonomic unit, or OTU. An OTU may either be a single specimen, or it may be a group of specimens which, when coded for the various characters, had the exact same entries and were therefore indistinguishable. Each column in the matrix is a hypothesis about how a particular character is distributed among the OTU's. If an OTU is the only one with a particular state, it is grouped by itself, which is not informative for building the tree. The distribution of character states must group two or more OTUs together in order for a character to be parsimoniously informative. Any matrix should have a good number of parsimoniously informative characters in order to support the building of the tree.
(d) character compatibility and cliques
The groupings encoded by each character within the matrix may together suggest a sensical pattern of divergence events, or they may conflict with one another. To understand the nature of the phylogenetic signal in the data set as a whole, a compatibility analysis can be done on the characters. Cliques of fully-compatible characters may be used to build an unconflicted tree, which cna be compared to the tree that results from using all of the characters. Compatiblity analysis is another tool biologists use currently to explore their data; it would be interesting if parallel coordinate plots could provide any insights to it.
Related Work
Searching the biological literature databases turned up exactly one explicit previous use of parallel coordinate plots [1], and I have seen only one vaguely biological reference to biological applications of parallel coordinates in any of the parallel coordinates literature [2]. However, one biologist pointed me towards an implicit use of parallel coordinates to display the relative positioning of homologous (analogous) genes on chromosomes from different species [3].
click to enlarge or reduce screenshot
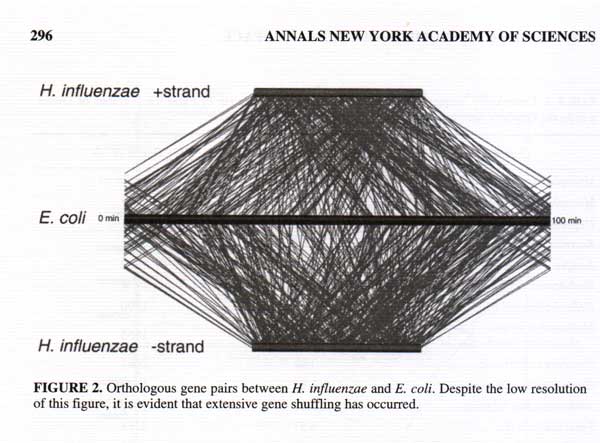
The location of a gene on each of three genomes is plotted with each line. The lack of symmetry between the two halves demonstrates that the genes have been re-ordered. [3]
Additionally, a very closely related visualization, the ratio diagram, is in use in mammalian systematics [4], and in fact parallel coordinate visualization tools might support population diversity studies by helping biologists to generate ratio diagrams.
click to enlarge or reduce screenshot
A Ratio Diagram. Demonstrating the relationships between mean skull measurements for x different species of small mammal in Amazonia, Brazil.[4](p. 122)
Methods - Tools, Data, and Collaborators
Data Explored
Four biologists personally contributed data sets to the project, and an additional data set was collected from GenBank. The data sets represent three different types of character data: morphometric, multistate, and protein.
Three of the data sets are morphometric - collections of anatomical measurements - one on wood rat skulls (3500 animals, ~24 measurements, one multi-state character), one on lizards (312 animals, 15 measurements, and two multi-state characters), and one on salamanders (62 animals, 12 measurements, file).
The fourth data set is a non-typical collection of multistate characters, where the same 10-state definition encodes the fur color on various body regions of Neotropical monkeys.
The fifth data set is derived of uncontroversially-alignable cytochrome b mtDNA sequences from Genbank, for howler monkeys (Genus Alouatta) and several outgroups. The sequences were published in two papers [5][6]. I used MacClade to align them by eye, translate them into protein sequence data, and remove all characters with missing and invariant entries for any taxon to reduce the number of axes (file).
Exploration Process
These data sets were converted to .stf (simple table format) for uploading into Parvis, a freely available software tool for parallel coordinate visualization and interaction. Non-numeric information, which cannot be plotted within Parvis, was either re-coded as numbers, maintained for identifying the record upon mouse-over, or cut out. Since parallel coordinate plots are challenged by missing information, some combination of removing records or removing characters was used to acheive a data set with no missing entries.
For three of the data sets, additional insight was available. After an initial interaction with the data, two biologists joined me for an additional exploration with their data set - the lizards and the wood rats. I am actively using the monkey fur color data set in another project, and used this project as an opportunity to see if any additional insights could be gained. The salamander and protein data sets were explored without the benefit of insight from the collecting scientist.
Although I originally intended to offer my collaborators a web tutorial on how to read parallel coordinate plots, I ended up explaining them in person.
Exploration Goals
While reviewing and interacting with the plots, I looked for evidence of the four phylogenetically significant phenomena above, and remained open to other benefits of parallel coordinate plots that might become apparent.
- (a) correlations between characters
- (b) suggesting characters for conducting gap analysis
- (c) parsimoniously informative characters
- (d) compatibility between characters and character cliques
Results
Morphometric data sets
Within the three morphometric data sets, parallel coordinate visualization helped me find several examples of (a) correlations and a nice example each of (b) a gap and (c) a parsimoniously informative character. In addition, several other patterns were observed that are likely to support the biologist in preparing data for phylogenetic analysis.
(a) correlations
Correlations, or evidence of non-independence, came in a variety of helpful styles within these data sets.
- emphasizing the need to scale characters from similar regions of the body in order to control for variability in the overall size of the organism. Mostly-horizontal slopes for the lines moving across a set of axes from the same part of the body emphasizes that the values on these axes are not representing independent characters.
click to enlarge or reduce screenshot
The salamander specimens with lower values for eye-to-nostril measurements also represent the smaller values within a number of different measurement ranges, probably reflecting a smaller body size. When other selections are performed, the medium-range values tend to group together, as do the higher range values. While body size may be an important character, it should be represented in one character, and its effect should be isolated from the values for the remaining characters.
- suggesting characters to combine to create a new character. When lines between two axes show two distinct types of slopes, it suggests that taking a ratio of these two axes might produce a character with a natural gap. Brushing high or low values on these axes individually may not produce a useful grouping, and this is a relationship unlikely to be apparent from looking at the data values themselves. See [8] for more on slope-brushing. The two axes will need to appear next to each other in the plot, possibly requiring the axes to be re-ordered in order to discover this condition.
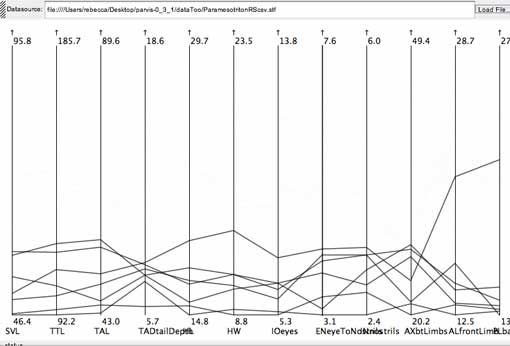
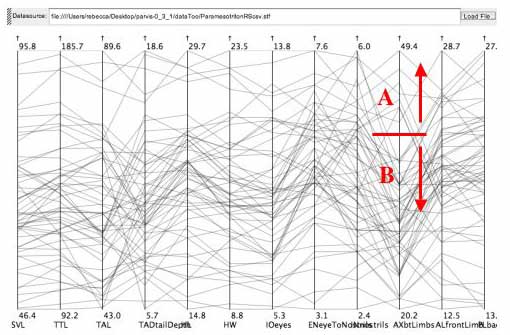
click to enlarge or reduce screenshot
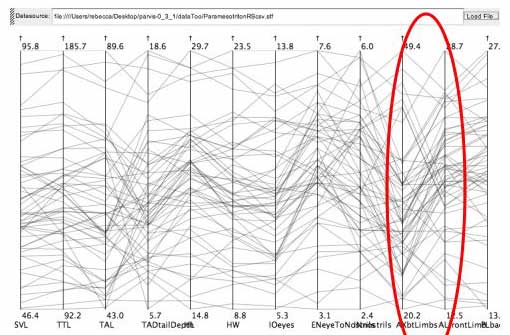
Lines between the AX axis (distance between the specimen's front and hind limbs) and the AL axis (length of front limb) in the salamander data set show two distinct types of slopes.
click to enlarge or reduce screenshot
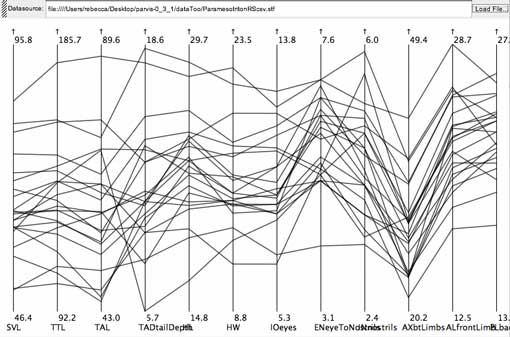
Members of the positively-sloped type. From the salamander data set.
click to enlarge or reduce screenshot
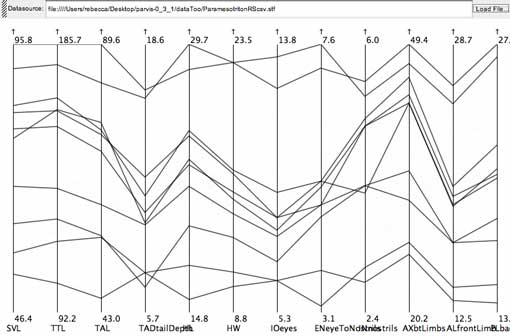
Members of the negatively-sloped type. From the salamander data set.
click to enlarge or reduce screenshot
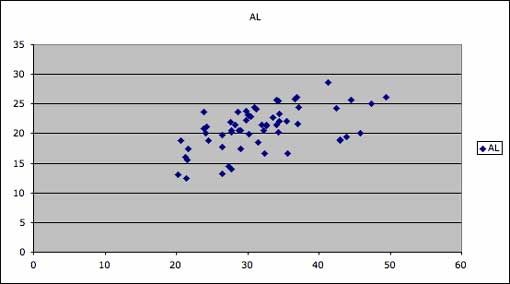
The same two axes circled above presented as a scatterplot in MS Excel. Two clusters with the smaller cluster to the upper right are visible, expressing the same pattern as the slope types on the salamander parallel coordinates plot.
click to enlarge or reduce screenshot
A similar set of two distinct slope types is visible in the third column from the right in the lizard data set, between the axes for abdominal area and throat area.
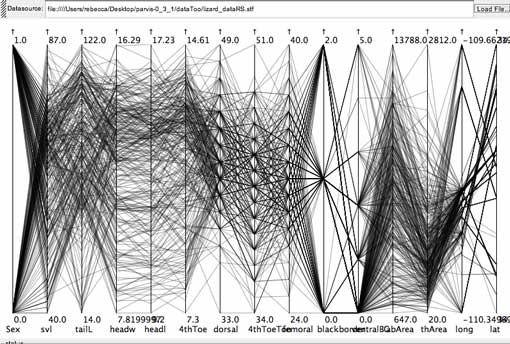
click to enlarge or reduce screenshot
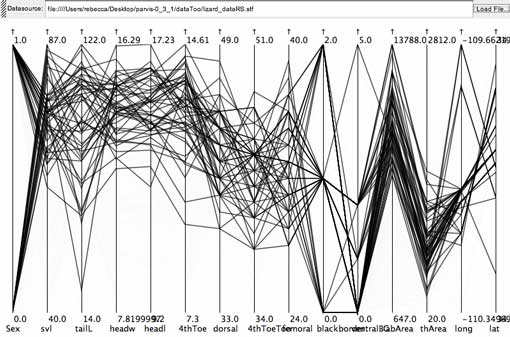
Brushing for the steep negative slope shows this relationship is present in the lizards with larger head sizes (headl is head length, headw is head width, the 4th and 5th axes from the left). There are plenty of specimens from both sexes representing this pattern (first axis on the left is Sex, where females are mapped to 0, and males to 1). The pattern is associated with particular populations (lat and long, the collection latitude and longitude, are represented on the two right-most axes), as some latitudes and longitudes are not represented within this subset of the data. This story is impossible to represent on one scatterplot.
click to enlarge or reduce screenshot
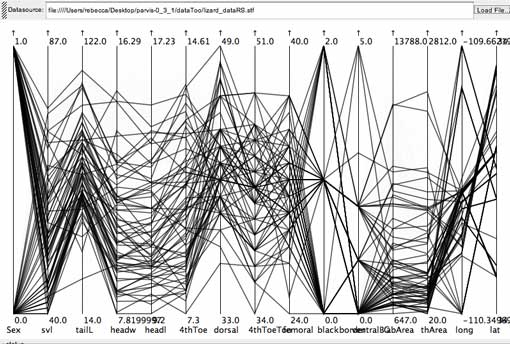
The other slope-type is associated with small to medium-large head-sizes in the lizard data set.
- testing potential multi-state characters by teasing out effects due to sex or age. Data might include a trial multi-state character. Brushing to select for members of sex or age classes quickly indicates if these subsets have an effect on the distribution of records into the potential character states. Sex-linked characters should only be included in a data matrix if all specimens analyzed are the same sex.
click to enlarge or reduce screenshot
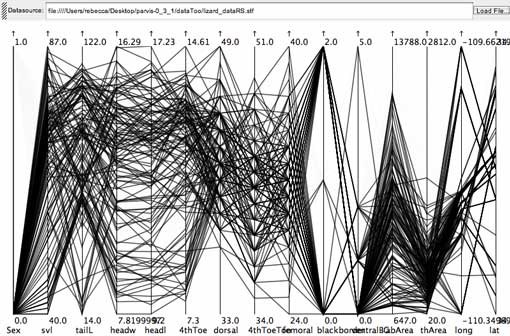
A brush for the females of the lizard data set (first axis on the left is Sex, where females are mapped to 0, and males to 1) shows that some character states of trial multi-state characters might be sex-linked. Only two females have character state 1 for the trial character "blackborder" (6th axis from right, with states 0,1,2). Character states 3 and 4 of trial character "ventralBG" (ventral background color, 5th axis from right, with states 0,1,2,3,4,5) are entirely absent among females.
- exploration of geographic variation or population effects. By brushing for populations or for the latitude or longitude of the collection locality, variation in measurement ranges for different groups of organisms can be checked for rapidly across all the characters. These variations may represent evolutionary changes that the biologist will try to identify good characters for.
(b) gaps
When the distribution of records along one axis was grouped into two smaller ranges separated by a gap, it suggested that a gap analysis should be conducted for that measurement.
click to enlarge or reduce screenshot
This gap was found on the AX (distance between front and hind limbs) measurement of the salamander data set.
(c) phylogenetically informative characters
When several lines move closely in parallel across the axes, it suggests that these specimens are likely to be coded as one OTU. Brushing to select those specimens that are part of character state A in the gap discussed above produced evidence of at least two OTUs, and therefore the character that results from coding the gap is likely to be parsimoniously informative.
click to enlarge or reduce screenshot
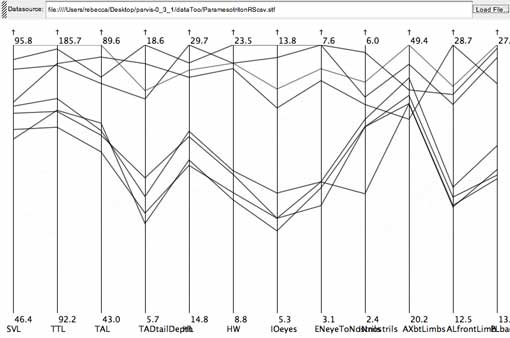
The set of four lines running together across the center of the axes is the signature of an OTU. The lines running across the top are less synchronized, so may be comprised of one or more OTUs. By grouping these lines together, this character is likely to be parsimoniously informative. From the salamander data set.
In addition to visualizing some of the phylogenetic features in the data, parallel coordinate visualization of morphometric data sets proved good for:
- providing an overall visual introduction to the data - its "feel" or "shape." While the biologists currently do this by making a series of two-character scatterplots, this visualization provides an overview, much as a map or diagram helps elucidate what textual directions mean.
- identifying suspicious data points. Outliers and other oddities are readily detectable on the plots. A tool that combines the selection of lines on the visualization plots with selection of the entry in the data editor and switches rapidly between the views outliers could help substantially when cleaning up large data sets.
click to enlarge or reduce screenshot
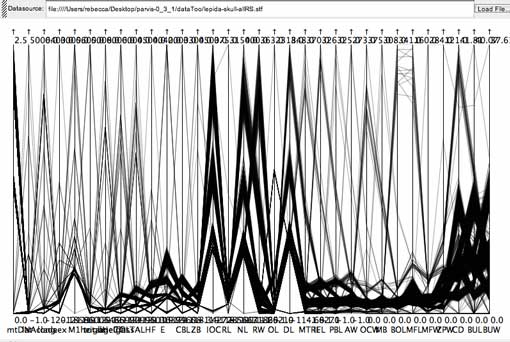
The parallel coordinate display can make outliers in data quite obvious. With ~3500 records in this woodrat data set, any points that plot away from the thick of the lines warrant closer investigation. Most of the spikes on the left several axes are one point creating a maximum value significantly out of range of the remaining values. Removing the outlier from the display will also allow a more investigatable distribution of the lines within the narrowed range of values.
Multi-state character data
The monkey fur color data set is rather unusual because the same set of states - fur colors - are used for coding each character. Because of this, the data set is probably a poor test of what can be learned by exploring multi-state character data in a parallel coordinates visualization, and as I understand better now with having done these explorations, it is more similar to a molecular data set than a morphological one.
Although some potential gaps were evident on the c4 and c15 axes, these turned out to be caused by a property of the character state encoding. The numbers 0 through 10 are used to encode two progressions, where 0 is the starting point for both progressions, 10 is the ending point. One progression is encoded by the lower numbers, while the other is encoded by the higher numbers. Thus gaps on these axes represented the idea that no coded taxa were following the lower progression on this character. Also, since in this instance the character states have already been selected and are not customized to a particular character, identifying gaps is perhaps misplaced.
Similarly, although this plot could be used to identify character states that do not group more than two OTUs, in this instance this would not cause an adjustment to the definition of character states. Also, the step matrix for the tree-making analysis in Paup enforces an irreversible progression, grouping taxa with other taxa at the same state and those with higher values. These considerations make it difficult to productively use the parallel coordinate plot to say anything useful about parsimoniously informative characters.
click to enlarge or reduce screenshot
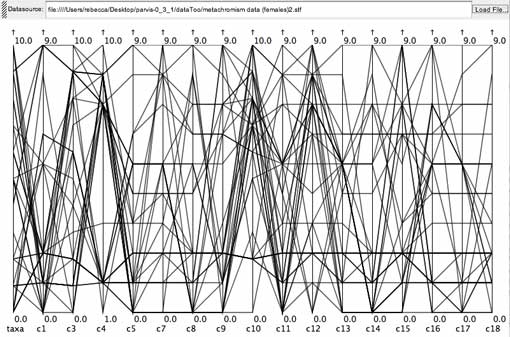
Monkey fur color data set.
Selecting the lines for just one genus of monkey did occasionally show a pattern where different taxa were at different points along the progression, which is a behavior that the hypothesis in question is interested in investigating.
click to enlarge or reduce screenshot
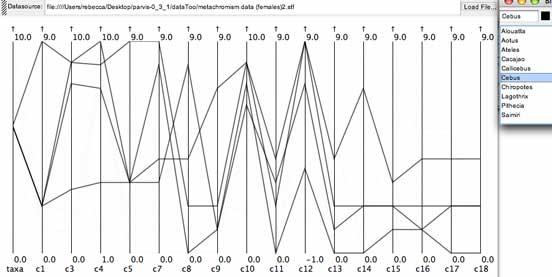
The Cebus monkeys from the monkey fur color data set. Each line shows roughly the same shape, suggesting there are genus-specific color patterns, while individual lines also are separated from each by steps along the color progression.
Overall, however, the special considerations for this data set make it a poor one to draw conclusions from about the usefulness of parallel coordinate visualizations for multi-character data sets.
Molecular data
The Alouatta protein data set had issues similar to the multi-state character set, although in this case it probably is a typical data set and a decent test of the usefulness of parallel coordinates visualization for molecular data.
click to enlarge or reduce screenshot
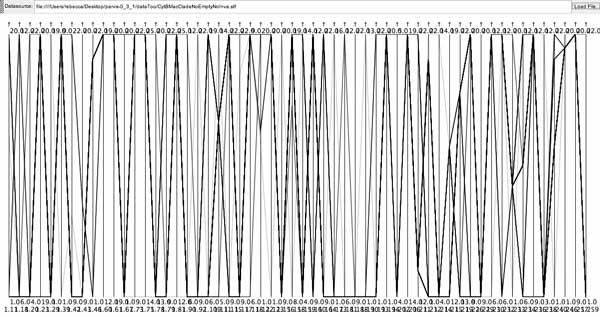
Alouatta cytochrome b protein data set.
Because of the low number of states for a given axis and the high number of axes, correlations between axes were not evident; nor would correlations, if discovered, have triggered the biologist to adjust the data. Because character states are already determined by the list of possible amino acids, gap analysis does not apply. While parsimonious characters might be identifiable, it is not clear that parallel coordinate visualization provides an improvement over views available in MacClade, with the possible exception of the fact that by combining taxa they all fit on the screen from top to bottom. Additionally, the data file required quite a bit of preparation to cut out invariant characters, and the number of axes remaining is a challenge to present effectively in the width of the monitor.
The high agreement demonstrated within the selected protein data set may be responsible for some of these results. Perhaps in data sets with more variability for a given character, it would be interesting to see how this variability is distributed, much like brushing for one sex or location and seeing what variation is represented in the selected set. However, it is hard to say what the significance might be of the result.
Conclusions
Overview
Interactive parallel coordinate visualization tools show the potential to be an important tool in the exploratory process that biologists already conduct while developing morphometric data sets into a character matrix. The visualization provides a valuable overview of the data, and a exploratory perspective unlike those provided with other tools, providing the opportunity for the biologist to discover something new in the data set. Brushing to select subsets of the data works nicely while details like sex, age-class, and collection locality are still part of the data matrix, and the effects of these biologically real categories needs to be teased apart from the phylogenetic signal. The use of parallel coordinate visualizations is likely to be most powerful and successful when combined with scatter plot visualizations, data editors, and other features as described in the section on "Tool Requirements for Systematics."
The parallel coordinate visualization and interactions visually demonstrate overall relationships in the morphometric/continuous-values data set, often showing the biologists patterns they already suspected but providing better perspective on how those are reflected in the data, as well as occasionally suggesting new directions. It is particularly useful for discovering patterns that involve more than two axes.
For molecular data, it's not clear that there exists an exploratory stage equivalent to that for the morphological data where a parallel coordinates visualization tool could contribute. Instead, biologists are in search of more automated, more algorithm-based, less subjective ways of dealing with molecular data, an aim which does not appear to be supported by this visualization technique.
Despite hoping to find evidence of character compatibility within a parallel coordinate visualization, none was found. This could be due to a poor data set for exploring multi-state characters, but is more likely due to the nature of the inter-axes relationships that are visualized by the parallel coordinate plot. Compatibility of state-coded characters is computable, and a compatibility tool could be developed for the interactive plots showing character state data matrices where selecting one axis causes compatible axes to turn a color. Whether this provides value for biologists' explorations is an open question.
Strengths and limitations
Parallel coordinates visualization of the roughly continuous data in morphometric data sets provides the opportunity to discover data features relevant to phylogenetic analysis such as correlations, gaps, OTU signatures, and parsimoniously informative characters. Discovery of these features helps the biologist sort the morphometric measurements into meaningful, appropriate, and independent characters and character states that might carry a solid phylogenetic signal to be visualized by the creation of a tree. As the characters are coded the usefulness of the parallel coordinate vizualization subsides and other existing tools for processing character data become more relevant. Multi-state characters are rather rare, and most coded characters are 2 states, which looks quite boring on the parallel coordinate plot!
Contrary to my hope when undertaking this project, any current process of finding these data features with parallel coordinates is not automatic or deterministic. Because of the extensive number of possible orderings for the axes in order to identify the classic parallel lines of correlations or crossing lines of a negative correlation, the identification of a novel correlation is somewhat arbitrary. A tile display of scatter-plots between all of the axes is a good complementary visualization for identifying patterns involving only two axes from a smallish pool of potential axes. These might point to correlations whose additional dimensions could then be investigated on the parallel coordinate plot. Tool features that automate the search for correlations between the axes, or assist biologists in rearranging the orders of the axes to search the realm of potential correlations, and even tools that searched for OTU signatures or made suggestions for other productive brushing choices would all help to improve the quality of the exploration process. The parallel coordinate visualization is one piece of the process, not a replacement for the process.
click to enlarge or reduce screenshot
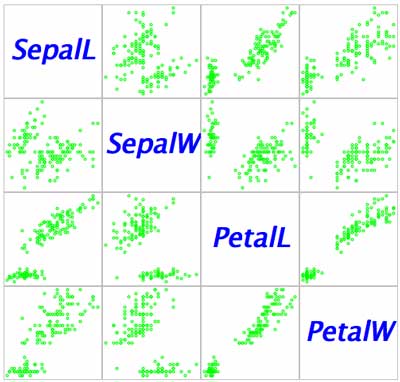
Example of a pair-wise scatter plot display for four axes. (source)
Nor are the insights provided by exploration with a parallel coordinates visualization decisive or discrete contributions towards the selection of independent characters; the meaning of the "events" in the data remains for the biologist to interpret.
How many dimensions is "multi-dimensional"? Although able to easily go beyond the two dimensions of the standard scatter plot, the number of dimensions that can be effectively visualized with parallel coordinates is still limited to a few tens by needing to fit within the dimensions of the screen and provide interaction. Sample data sets provided with the tools had from four to eight axes, and the larger data sets examined in this project displayed 22 (morphometric, wood rat data) and 56 (molecular, protein data) characters/axes at one time. The ability to display many more axes than this is probably limited.
A large number of records seems less problematic: the wood rat data set had ~3500 records at one point, and the main challenge was removing the large numbers of outliers in order to have the values auto-displayed on axes scales where the min and max gave the values a more useful distribution. The large number of record lines may have been obscuring patterns that would be easier to see with smaller record sets.
Future Work
Extensions of the work begun in this project could go in a variety of directions.
I am still interested in exploring a more traditional multi-state character data set, which might most realistically mean interacting with a morphometric data set towards the end of the exploration and refinement process, where it is nearer to the final character state data matrix. The morphometric data sets in this study were all fresh off the calipers.
Within my limited experience, it appears that entomologists often publish the huge morphological charcter matrices. I'd like to try an entomologists' data set, which tend to have more measurements, to test just how many dimensions can be effectively visualized with this approach.
Inspired by the chromosome visualization in the "Related Work" section, I am interested in asking if a parallel coordinate view of homologous chromosome segments in human, Cebus appella, Lagothrix, and Alouatta chromosomes would help me to move beyond the current presence/absence encoding of simple segment associations to a more appropriate encoding of specific evolutionary events. The tricky part is recognizing character states that are comprised of the fused/independent status of multiple segments at once. Is this a data feature readily identifiable from a parallel coordinates view? I'd like to think this through.
Lastly, it would always be fun to draw up the specifications for a new parallel coordinates application or plug-in that implements some of the feature recommendations in the section on "Tool Requirements for Systematics." Paper prototypes and user interviews to develop the design of this tool would be right up my alley.
Comparing Parallel Coordinates Interaction tools
Having used Parvis and gathered a sense of what is needed in an interactive parallel coordinates visualization tool for supporting systematics work, I set out to identify the pros and cons of other interactive tools that support parallel coordinate visualizations. I examined the xMDV Tool, which is pioneering various different dimension-reduction views of multi-dimensional data, and West and Bradley's Java applets for providing interactivity with data sets via the web.
Both of these tools provide (among other visualizations) a pair-wise tiling of scatter plots as a nice companion visualization to parallel coordinates. They also provided default applications of color that help to distinguish the selected set from the entire data set. Each of the three tools had a different brushing behavior, and a different file format.
click to enlarge or reduce screenshot
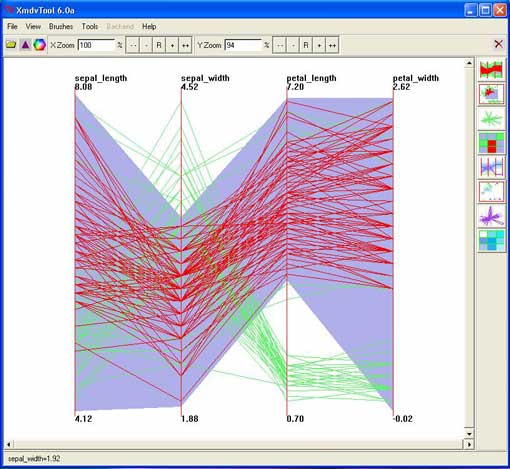
The xMDV tool, showing a slope-sensitive brush (purple shading) that has selected the lines in red from an Iris data set. By shaping the purple shadow, xMDV combined in one brushing tool what has been implemented as two distinct tools in Parvis. Manipulating the purple shadow for simple brushes requires more clicks than Parvis' point-and-drag. Intuitiveness is an open question for both implementations.
After reviewing the other two tools, I appreciated the good fortune of having selected to work primarily with Parvis. Parvis is relatively easy to create & edit files for; more robust to file-format variety and errors; and provided for saving brushes and adding, subtracting, or taking the intersection of two brushes. It also allows any number of string fields to be included in the data; provides for re-ordering the axes, and generates the scale for the axes dynamically rather than requiring them as part of the file format. Parvis isn't perfect, however - it provides no feedback about file format issues, would occasionally find itself in a confused state that required re-starting, and has a seriously un-intuitive interface that tends to trick the user into entering that confused state.
Tool Requirements for Systematics
The tool comparison and exploratory interviews with scientists identified salient features of the data exploration process for systematics, and pointed to what an interactive application should do to best support this process.
Dynamic Data
This data exploration involves a data set that is still dynamic, as opposed to the exploration of a static data set. The selection and representation of the information is still in flux. Tool features should support a close relationship between the visualization and the data editor. Parvis' file format was relatively easy to update and the information flow maintained label(string) information with the record, but the ideal interface might provide selection and highlighting reciprocally across table and visualization views, as I have seen in ESRI's ArcVIEW GIS software.
Process it!
This dynamic data might need to be grouped & averaged, randomly sub-setted, scaled, zero-corrected (see the ratio diagram in "Related Work"), and have gaps and correlations checked for statistical significance. Axes should be re-orderable and the new order saved. A good combination with a scatter-plot display is essential (see Simon King's exploratory project). Automatic searches for correlations, optimal axes orderings, useful brushings, and compatibility analysis could also be developed. These abilities would support significant portions of the data exploration task within one software package.
Provide A-Z axes
Text field entries are often from a list, or are only a limited set of unique values. The tool should be able to array text values on an axis from A to Z and show where each line intersects the alphabetic axis. Brushes and groups should be creatable from sections of this axis just like any other.
Handle missing data points gracefully
Missing data entries for a character are simply a part of life in systematics, and tree-making tools have developed approaches to interpreting the appropriate interaction with these missing values. A parallel coordinates plot tool intended for use by systematists would also seek appropriate representations of the lines when intersection values are missing.
A critical key to making parallel coordinates exploration a widely-used tool in systematics is making it easy to use: the greater the inter-operability with standard spreadsheet, statistics, and tree-making software tools and the more value it provides to the investigator to use this tool to understand and refine their data set, the more use such a tool will see.
A good, simple start would be providing a parallel coordinates plot as part of a standard spreadsheet program.
References
[1] Patil. An ecological assessment of the United States mid-Atlantic region using rank frequency distributions based on watershed quintiles.
COMMUNITY ECOLOGY AN INTERDISCIPLINARY JOURNAL REPORTING PROGRESS IN COMMUNITY. Vol:3, no:1, pp:1, 2002.
[2] Xmdv Tool: Case Studies: Geochemical data: heavy metals in moss.
[3] Bellgard, Matthew I.; Itoh, Takeshi; Watanabe, Hidemi; Imanishi, Tadashi; Gojobori, Takashi. Dynamic evolution of genomes and the concept of genome space. Caporale, L. H., Ed. ANNALS OF THE NEW YORK ACADEMY OF SCIENCES; Molecular strategies in biological evolution. Vol:870, pp:293-300, 1999.
[4] Patton, James L.; Da Silva, Maria Nazareth F.; and Jay R. Malcom. Mammals of the Rio Juruá and the evolutionary and ecological diversification of Amazonia. BULLETIN OF THE AMERICAN MUSEUM OF NATURAL HISTORY. Vol:244, pp:1-306, 2000.
[5] Bonvicino, Cibele R.; Lemos, Bernardo; Seuánez, Héctor N. Molecular phylogenetics of howler monkeys (Alouatta, Platyrrhini): a comparison with karyotypic data. CHROMOSOMA. Vol:110, pp:241-246, 2001.
[6] Cortés-Ortiz, L; Bermingham, E.; Rico, C; Rodríguez-Luna, E.; Sampaio, I; Ruiz-García, M. Molecular systematics and biogeography of the Neotropical monkey genus, Alouatta. MOLECULAR PHYLOGENETICS AND EVOLUTION. Vol:26, pp:64-81, 2003.
[7] Lipscomb, Diana. Basics of Cladistic Analysis. George Washington University. Washington, D.C. 1998
[8] Helwig Hauser, Florian Ledermann, Helmut Doleisch. Angular Brushing for Extended Parallel Coordinates. Proceedings of the IEEE Symposium on Information Visualization 2002 (InfoVis 2002), Oct. 28-29, 2002, Boston, MA, pp. 127-130.