Annotated Bibliography
Contents
Basic Tree Visualization
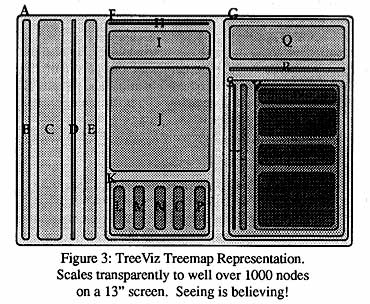
TreeViz: Treemap visualization of hierarchically structured information. Brian Johnson. CHI '92. "Johnson92TreeViz.cfm"
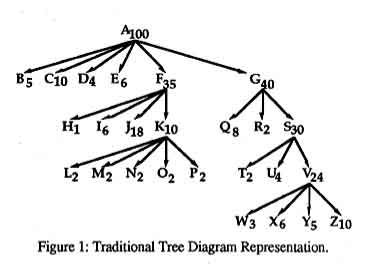
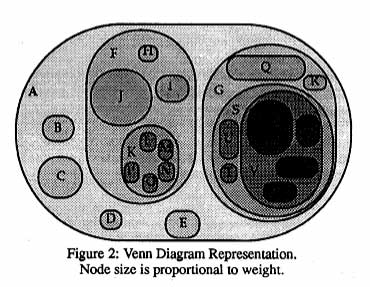
Johnson sings the praises of the Treemap representation. The Treemap strategy uses a space-filling mosaic of rectangles to represent each node in the tree, where the nesting of the rectangles reflects their hierarchical relationship. The approach explores an entirely different dimension for representing trees; instead of running out of space in any linear dimension for a standard tree diagram, sparse or extensive trees will always fill the space, and the visual properties will convey something about the extensiveness of the branches and the distribution of nodes on the tree. Several levels of nodes can be shown at once, and othesr can be revealed upon zooming in. Size and color of the rectangles can be used to represent other qualities of the information at each node. Compared to other, less-visual ways of representing tree-structured data, Johnson suggests Treemaps "increase the bandwidth of the human-computer interface." Figures 1 thru 3 (shown left) show the conversion of a tree diagram to a Treemap; see also Hennig's early diagram in the Tree of Life Gallery. The Treemap representation continues to be developed at University of Maryland, and there are java tools for implementing Treemaps. For interactive examples of Treemaps in action, see SmartMoney's marketmap and Peet's tea selector. A Treemap visualization of the tree of life could use color to identify major tree branches, display names of major branches simultaneously, help viewers keep themselves oriented in the tree, and provide different degrees of resolution on zooming in and out of the Treemap.
Visual exploration of large data sets. Daniel A Keim. Association for Computing Machinery. Communications of the ACM; Aug 2001; 44, 8; ABI/INFORM Global pg. 38. "Keim2001VizLargeDataSets.pdf"
Keim proposes that the combination of humans and effective visualization of large data sets is killer for getting something meaningful out of large quantities of data. The visualizations must leverage human perceptual abilities. The data visualization mantra, "overview, zoom & filter, and details-on-demand" strikes me as a great goal for the desired Tree of Life visualization. Also see figure 5, where the tree structure is displayed on a loose spiral and shallow hemisphere.
click to enlarge or reduce screenshot
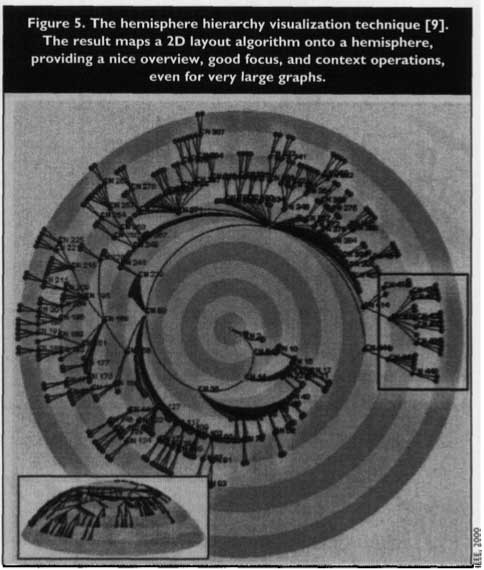
Figure 5 in Keim article (from:A scalable framework for information visualization, see below) displays a tree structure in a loose spiral. This allows the entire structure of the tree to be seen in less space. It may provide a good "context" for a focus-plus-context display of the Tree of Life.
A scalable framework for information visualization. M. Kreusler, N. Lopez, and H. Schumann. In Proceedings of Information Visualization '00 (Salt Lake City, UT, Oct 9-13). IEEE Computer Science Press, los Alamitos, CA 2000, 27-35.
reference for the figure 5 in Keim article.
BDEI: Biodiversity Information Organization using Taxonomy (BIOT). Dr. Susan Gauch. "gauchBiodivInform.pdf"
This proposal narrative provides an overview of the BIOT project, which is described in more detail in the comparative analysis. The BIOT project uses biology's taxonomy as a way to classify and access information on the web, providing audience-specific information and better precision than Google for the much smaller subset of web information on organisms and biodiversity.
The evolution of supertrees. Olaf R.P. Bininda-Emonds. TREE 2004. "Bininda-Emonds2004Supertrees.pdf"
There's no easy way to know how best to combine the trees that result from different studies, which look at branches at different depths. This paper reviews some different approaches. It uses standard tree diagrams.
TaxonTree: Visualizing Biodiversity Information. Cynthia Sims Parr, Bongshin Lee, Dana Campbell, and Benjamin B. Bederson. "TaxonTree2003-40.pdf"
The TaxonTree attempts to provide an integrated searching/browsing interface for learning about the structure of the animal branch of the tree of life, and for retrieving online information relevant to a given node. See the comparative evaluation for more about TaxonTree. This paper reports on a study with undergraduates in an animal diversity course, and their success and satisfaction at using TaxonTree to find and understand information about animal groups. It provides insights into one audience for this type of information, an audience that falls somewhere between biologists and the general public. "Users tended to be interested in looking for animals using common names and above the species level e.g. “frogs.” (Order Anura). Specifically, when asked to choose any animal to find, users gave 20 out of 26 initial targets as common names rather than scientific names."-p. 5. "When asked the kinds of information they were interested in, 5 of 13 teams mentioned way of life (food habits, behavior, ecology). Five of 13 teams noted that they enjoyed learning unique characteristics of animals – interesting superlatives or what sets an animal apart from others. Four user teams mentioned that they wanted only the information necessary to pass their course. Two user teams mentioned an interest in evolutionary relationships. One user wanted information to distinguish dangerous from harmless animals."-p. 5. "Most users preferred browsing the tree over searching. Only three of 13 teams used searching as an initial strategy – these were all high interest users ideas of what search terms to use." -p.6. Interaction preferences varied among users depending on their interest level: "High interest user teams, like our design partners and our staff biologists, preferred manually closing and opening branches. Low interest users preferred auto-closing."
What storytelling can do for information visualization Nahum Gershon; Ward Page Association for Computing Machinery. Communications of the ACM; Aug 2001; 44, 8; ABI/INFORM Global pg. 31. "GershonPage2001-Viz&Storytelling.pdf"
Beamtrees: Compact visualization of large hierarchies. Frank van Ham, Jarke J. van Wijk; InfoVis 2002.
Beamtrees are inspired by treemaps, but use overlapping rather than nesting to indicate branches within the dataset. Child beams are turned 90 degrees from the orientation of their parent, and sized proportionately to the number of children within their branch. Leaf nodes are represented with bands of color on the parent beam, to avoid lots of little objects. User tests with 3-D beamtrees representing file system data in an interactive environment and tasks related to file sizes gave positive results for beamtrees.
click to enlarge or reduce screenshot
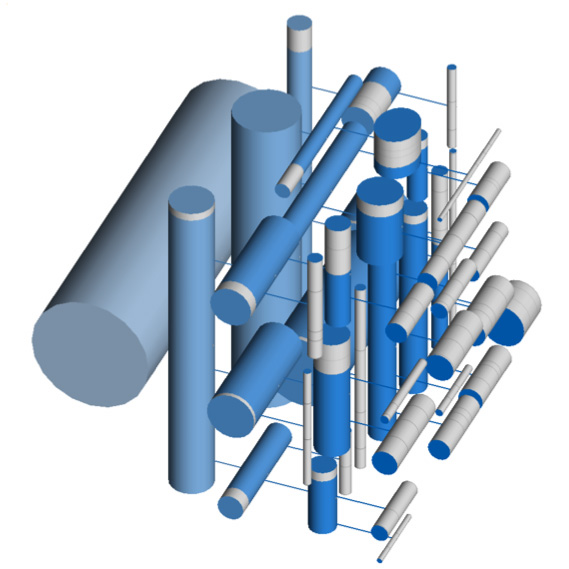
Beamtrees represent a quite original approach to representing hierarchical data. Sizing branches proportionately to some attribute (here, it's filesizes) is likely to be popular. The beamtree does give a quick overall view of the large hierarchical data set. I think the size of the tree of life might overwhelm it, however.
Cushion Treemaps: Visualization of Hierarchical Information. Jarke J. van Wijk, Huub van de Wetering; (InfoVis 1999)
Improving on earlier treemaps, cushion treemaps use shading to enhance the visibility of the structure.
click to enlarge or reduce screenshot
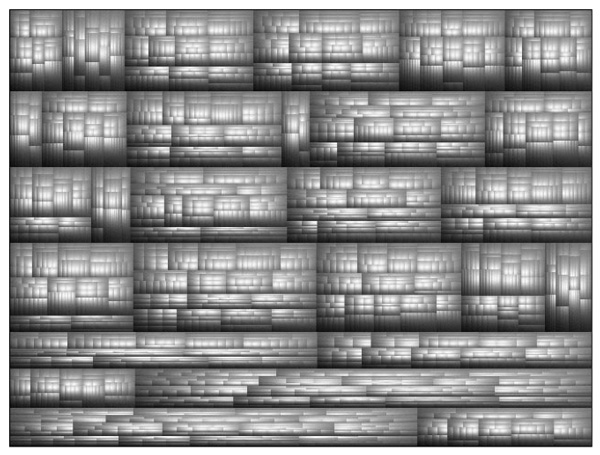
A cushion treemap.
On Multiple Trees
TreeJuxtaposer: Scalable Tree Comparison using Focus+Context with Guaranteed Visibility. Tamara Munzner, François Guimbretière, Serdar Tasiran, Li Zhang, Yunhong Zhou. "MunzerComparingTrees.pdf"
The Challenge of Visualising Multiple Overlapping Classification Hierarchies. Martin Graham, Jessie B Kennedy and Chris Hand. "UIDIS"
A Comparison of Set-Based and Graph-Based Visualisations of Overlapping Classification Hierarchies. Martin Graham, Jessie B Kennedy, Chris Hand. ACM 2000. "p41-graham.pdf"
Pullan, M.R., Watson, M.F., Kennedy, J.B., Raguenaud, C. & Hyam, R.: The Prometheus Taxonomic Model: a practical approach to representing multiple classifications. - Taxon 49: 55-75. 2000. "Pullan00Taxon.pdf"
Visualising Multiple Overlapping Classification Hierarchies. PhD. Thesis. Martin James Graham. Napier University, December 2001 "GrahamThesisFinal.pdf"
Technical Background
Managing complex taxonomic data in an object-oriented database. Cédric Raguenaud. Extended Abstract."managing-complex-taxonomic-data.pdf"
Database Support for Taxonomy. Cédric Raguenaud, Jessie Kennedy, Peter J. Barclay. "raguenaud99database.pdf"
Processing Star Queries on Hierarchically-Clustered Fact Tables. Nikos Karayannidis, Aris Tsois, Timos Sellis, Roland Pieringer, Volker Markl, Frank Ramsak, Robert Fenk, Klaus Elhardt, Rudolf Bayer. Proceedings of the 28 th VLDB Conference, Hong Kong, China, 2002."