Tree of Life Gallery
Some notable examples of current visualizations of the Tree of Life are collected here. More extensive analyses of current projects are available on other pages.
UCMP's Evolution website for teachers
The new teacher's resource website on evolution, evolution.berkeley.edu, presents a simple visualization of our place in the tree of life. Shown in-the-round, the tree emphasizes the three domains of life, replacing earlier ideas of "kingdoms." This representation uses attractive images and colors, labels branches at a resolution that will be digestable by most viewers, giving branches proportional space, and displays time/evolutionary distance by radiating out from the center of a circle.
click to enlarge or reduce screenshot
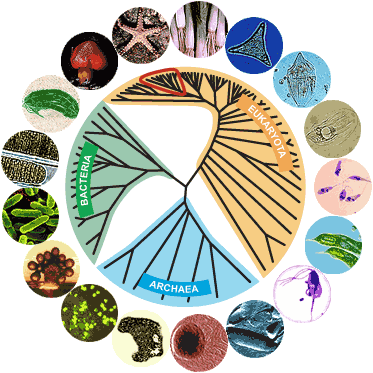
The three domains of life, from the new teacher's resource website on evolution, evolution.berkeley.edu
Dennis Wall's Phylomonography
Dennis P. Wall presents his dissertation work on mosses in a novel way, using technology to reflect his philosophy of phylogenetics and to present the supporting evidence, including pictures of characters and a distribution map of specimen locations. This representation is similar to a standard tree diagram structure, but leverages interactivity to compress the display and also provide access to supporting information.
click to enlarge or reduce screenshot
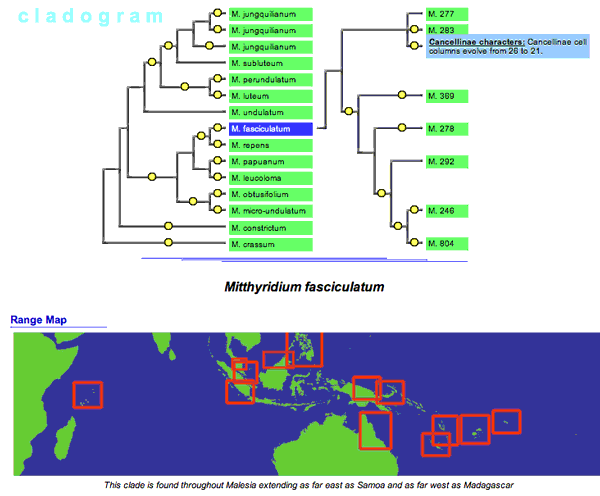
A phylomonography of some mosses: Two levels of nodes are labeled: the leaf nodes or specimens (narrower green boxes farthest to the right), and a selected group of higher-level nodes, seen as the wider green boxes in the center. Clicking a higher-level label reveals the tree-diagram structure for the nodes and specimens/leaves below it. Click any node circle or specimen to display supporting information. This example also demonstrates two coordinated viewers on the same data set; the location where the specimen was collected is show simultaneously on the geography viewer below.
The hyperbolic tree browser
click to enlarge or reduce screenshot
The prototype interface for the Phylogeny-Ecology-Geography information system project implements a hyperbolic tree browser for navigating the phylogenetic tree of one genus.
click to enlarge or reduce screenshot
The results for the Green Plants branch of the Tree of Life project are shared online in a hyperbolic tree browser.
A Spherical take on the tree of life
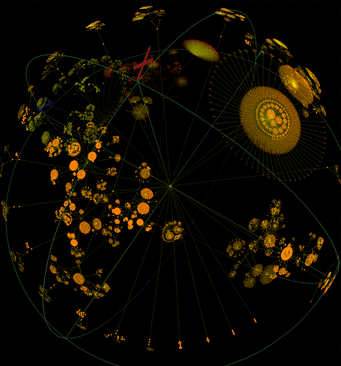
WALRUS is a Java toolkit that provides the ability to visualize large tree datasets by arranging the leaf nodes on the surface of a sphere. Tim Hughes has posted a nifty picture of "the whole NCBI taxonomy database which currently contains approx. 180,000 nodes (as close as one can get to a tree of life at the moment)." While this sphere visualization is nifty, I doubt that it would prove an effective visualization, either as static pictures or as an interactive object, for any of our audiences.
Static diagrams from 'Assembling the Tree of Life'
Documenting the current state of knowledge at the beginning of NSF's Tree of Life initiative, the book Assembling the Tree of Life (Eds. Cracraft and Donoghue, Oxford University Press, 2004) presents various static versions of the tree. More diagrams from this book are discussed in the Comparative Analyses.
click to enlarge or reduce screenshot
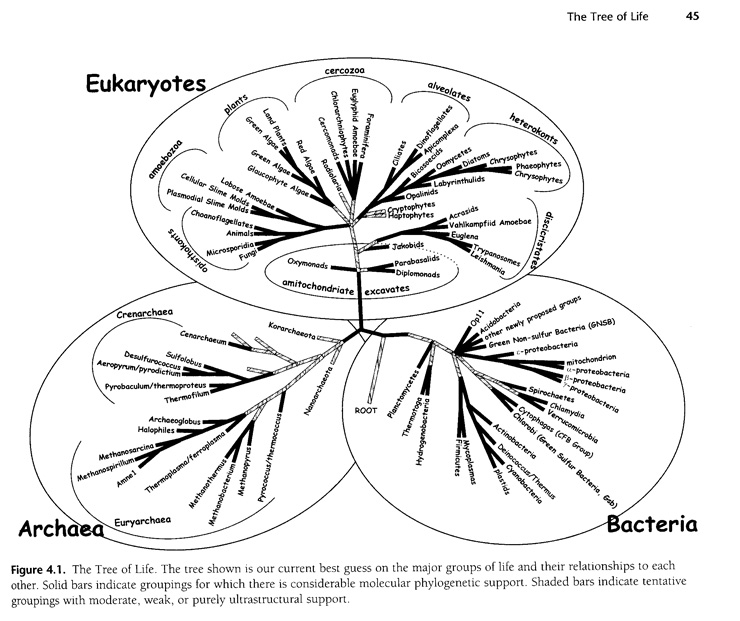
This diagram focuses on the major branches of the tree of life. Different colors are used to indicate features of the branches; in this case, the darker the branch, the more likely it is to be right.The rounded branching display and fonts are friendly, but this isn't a teachable tree. For public or high school audiences, there are possibly two recognizable words: "Bacteria" and "plants". Even I don't know where humans would be on this tree.
Hennig's Tree diagram
Willi Hennig's Phylogenetic Systematics (University of Illinois Press, 1966) is a foundational text for modern phylogenetics. In figure 18, Hennig shows the interconnection between branching diagrams and nesting diagrams, and remains equivocal about which is best for displaying the evolutionary relationships phylogenetic methods aim to uncover. Tree diagrams are now widely used, although set-based nesting diagrams have the advantage of discouraging naming of paraphyletic groups. A modern example of set-based tree visualization is the treeMap.
click to enlarge or reduce screenshot
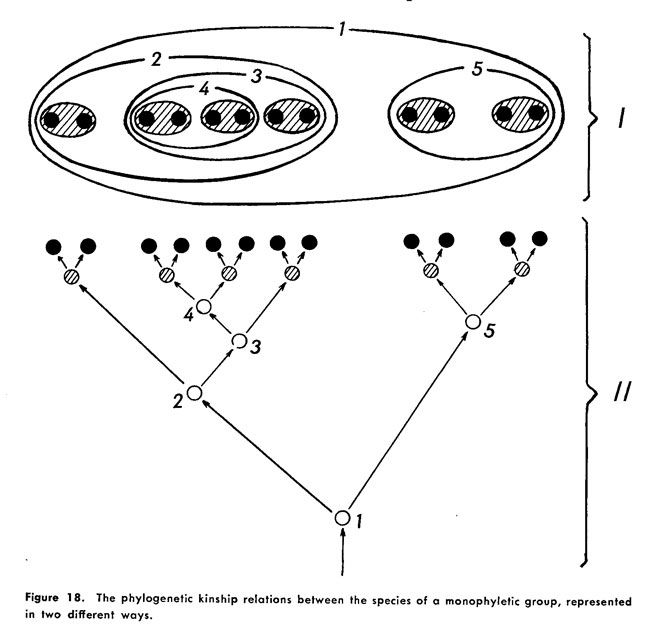
Hennig's figure 18. The caption reads: "The phylogenetic kinship relationship between the species of a monophyletic group, represented in two different ways." The top (I) shows a set-based, nesting diagram, while the bottom (II) shows a branching tree diagram.
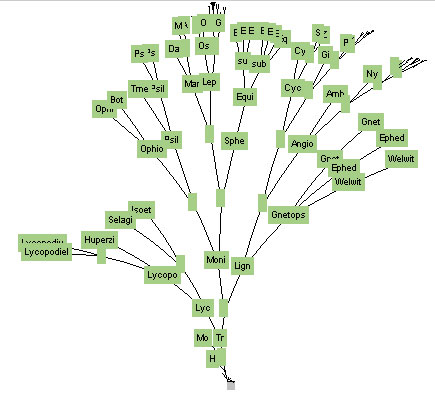
WinClada's interactive clade tree webpages
click to enlarge or reduce screenshot
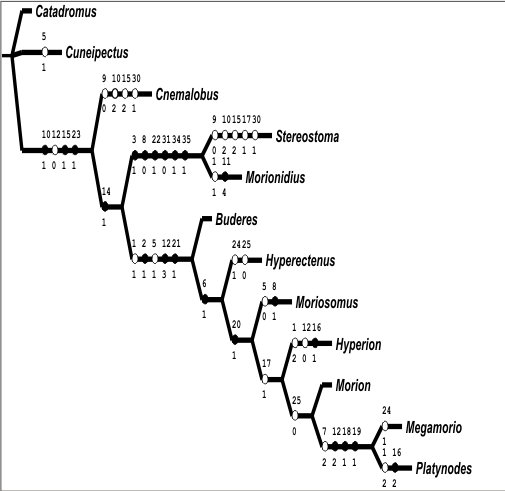
WinClada is a phylogenetic analysis software that can also output interactive tree websites. This example of a clade tree visualization comes from Kip Will at U. C. Berkeley, and shows the relationships of the genera of Morionini beetles. Thecharacters mapped onto the tree are clickable in the original graphic, jumping to another page with a list of characters and some pictures of character states. The information is all there, although the interaction experience in the website implementation is less than ideal.